

TL;DR
Reducing restaurant packaging costs does not mean buying cheaper containers. The real lever is standardization: fewer container types, shared lid systems, and deeper volume buys on a smaller SKU count. Start by calculating your actual per-order packaging cost. A three-size framework covering 4 oz, 16 oz, and 32 oz handles the majority of any menu, cuts storage pressure, and unlocks better unit pricing without touching the quality your customers expect.
Ask how to reduce restaurant packaging costs and most operators instinctively reach for a cheaper container. That move is wrong, and it is costing them more than they realize. For example, a packaging swap that saves $0.03 per unit can wipe out weeks of savings if a lid pops on delivery or a base buckles under a full entree. Packaging cost is not just a per-unit number. It is a per-order number, and most restaurants have no idea what that figure actually is.
The stakes are real. The National Restaurant Association reported in May 2025 that nearly 75% of all U.S. restaurant meals are now served off-premises. Your containers go out with almost every order. At that volume, a smart packaging structure is not optional. It is a direct line to margin.
At Plastic Container City, we work with food professionals across the U.S., from busy takeout counters to single-truck operators, and the same cost problem keeps coming up: too many container types, ordered in too-small quantities, with no line-item tracking. This guide addresses all three.
How Is Packaging Cost Per Order Actually Calculated?
Direct Answer: Divide total monthly packaging spend by total monthly order count. A restaurant spending $600 across 600 orders pays $1.00 per order.
Most operators treat packaging as a supply cost. It is. But it is also a per-order cost, and treating it that way changes how you buy. The formula is straightforward:
Monthly packaging spend ÷ monthly order count = cost per order
Pull your last three supplier invoices. Add up what you spent on containers and lids. Divide by your order volume for the same period. That number tells you more than any per-unit price on a product listing.
| Monthly Packaging Spend | Monthly Orders | Cost Per Order |
|---|---|---|
| $300 | 500 | $0.60 |
| $500 | 500 | $1.00 |
| $750 | 500 | $1.50 |
| $600 | 1,000 | $0.60 |
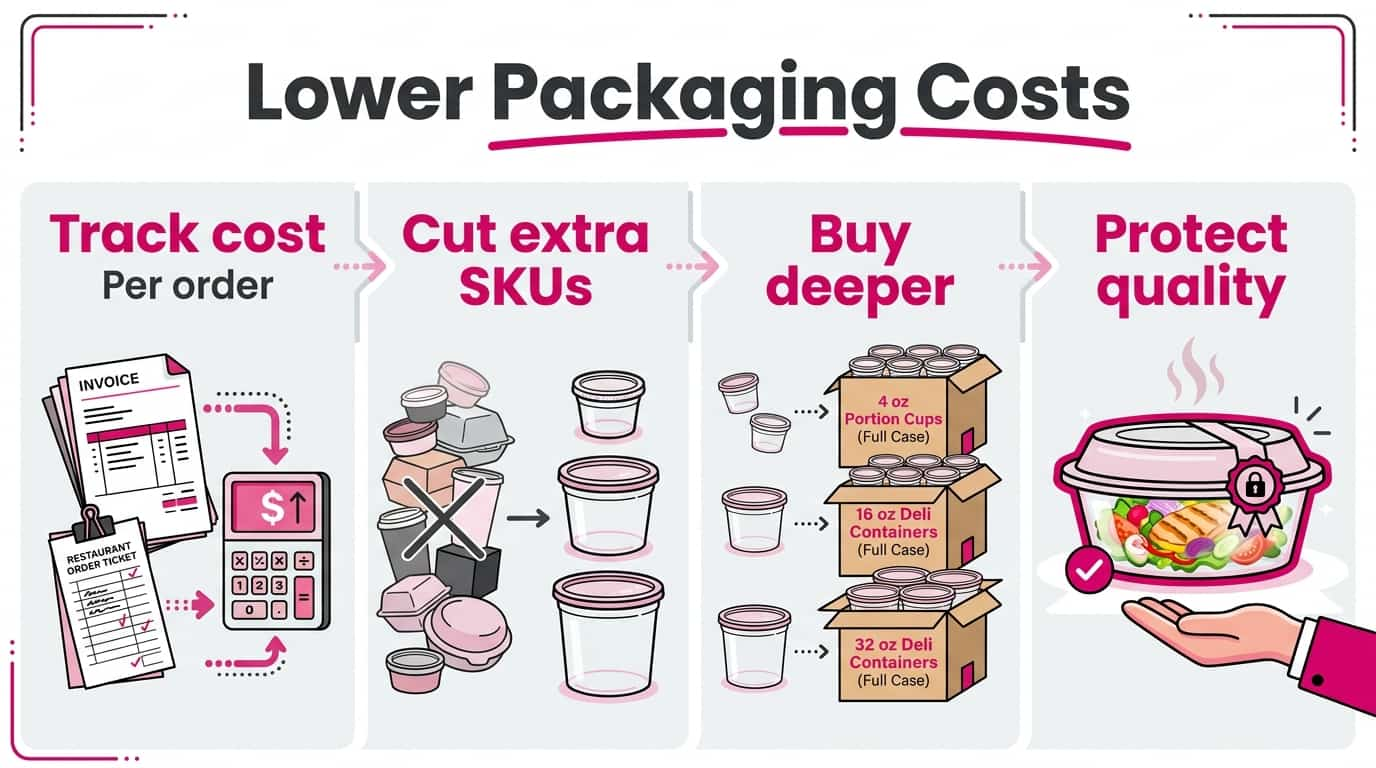
Once you have that number, every packaging decision gains a frame of reference. Consolidate from 10 SKUs to 4, increase order volume, or negotiate a volume tier with your supplier, and the cost-per-order figure will move. That is your scorecard.
The Foodservice Packaging Institute's Q1 2025 State of the Industry report found that more than 80% of packaging manufacturers and suppliers saw profits worsen or stay flat versus 2023. That pressure moves downstream to operators. The National Restaurant Association also flagged in March 2026 that tariffs on materials including steel and aluminum may raise packaging and equipment costs for restaurants. May 2026 trade reporting quoted the National Restaurant Association's CEO saying operators had kept menu price increases to 30% while food costs had risen 40% over the last five years. Knowing your per-order number is not just accounting tidiness. It is how you stay ahead of cost pressure before it lands on your margin.
What Is the Single Biggest Lever for Reducing Packaging Costs?
Direct Answer: Standardization. A three-size framework with shared lids reduces per-unit cost and reorder complexity without touching quality.
Walk into most independent restaurant kitchens and you will find eight container types when three would handle the same menu. Every extra SKU means a smaller order quantity, a higher per-unit cost, more storage space used, and more reorder decisions to make each month. The savings are not in the container price. They are in the container count.
What Three Container Sizes Cover Most Menus?
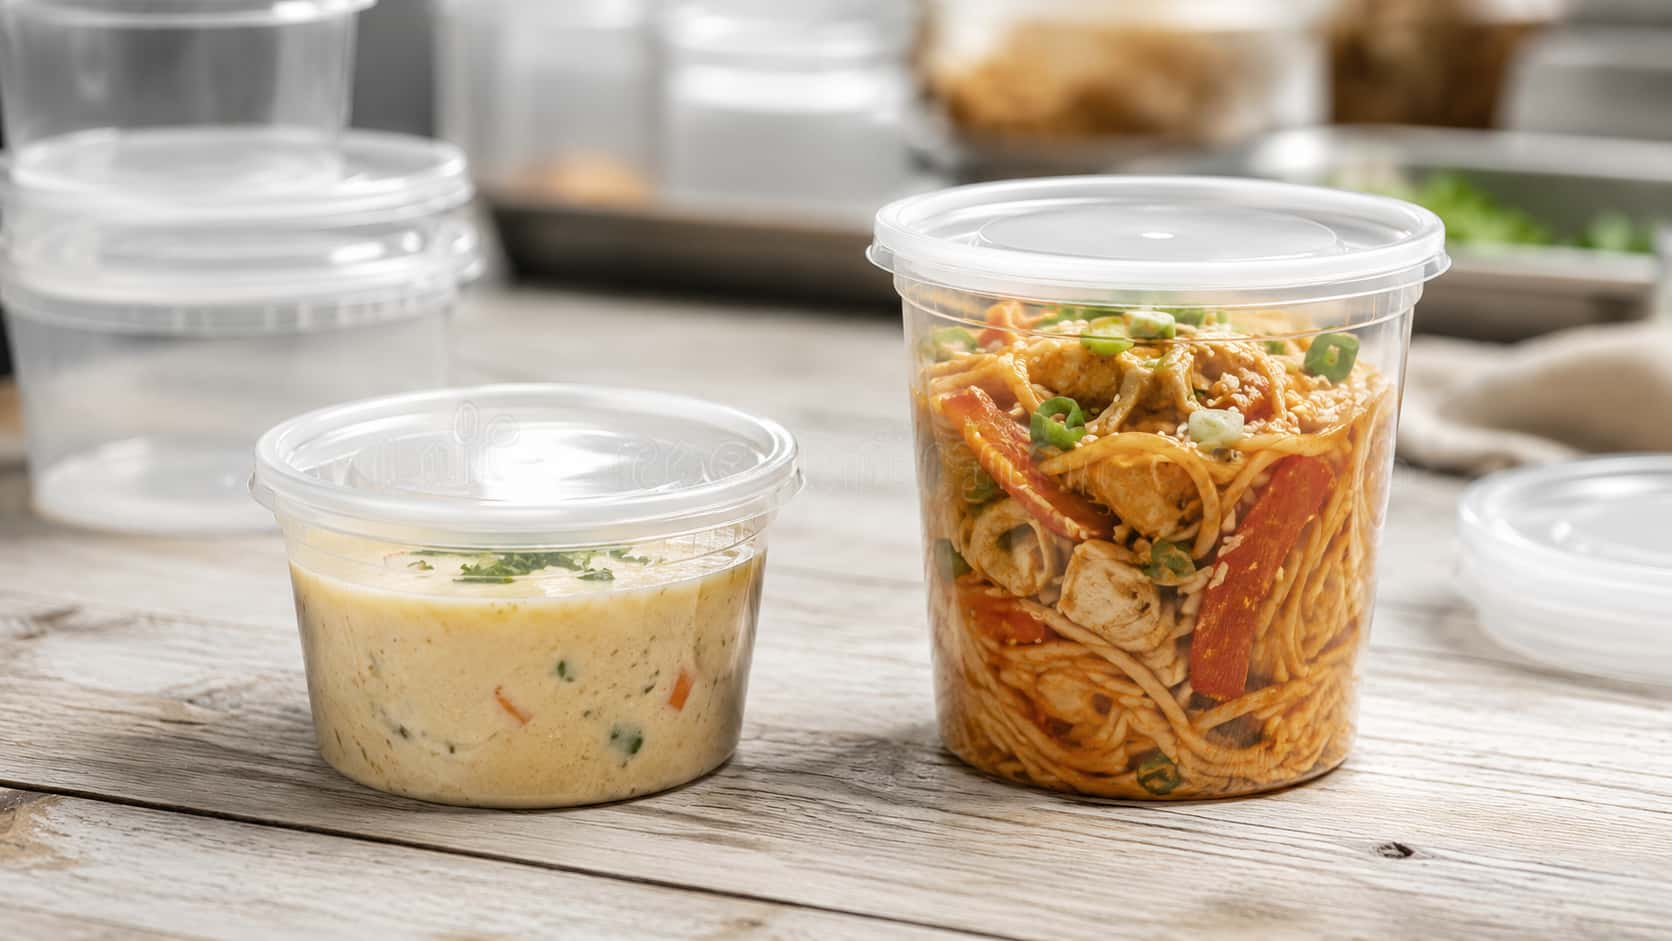
Direct Answer: 4 oz for sauces, 16 oz for soups and sides, 32 oz for full entrees. PP for hot food, PET for cold. These three sizes cover most takeout menus.
For most takeout and delivery operations, three container sizes cover the full menu without over-stocking:
- 4 oz covers sauces, dressings, and condiment cups.
- 16 oz handles soups, sides, and smaller entrees.
- 32 oz covers full entrees, grain bowls, pasta, and stir-fry.
That is it for most menus. Polypropylene (PP) for hot food, PET for cold. Three sizes, one material per temperature range, and you have covered the majority of any takeout operation. Operators serving family-size portions or catering can add a 48 oz format, but most kitchens do not need that fourth size.
How Do Shared Lids Cut Packaging Costs?
Direct Answer: One lid that fits your 16 oz and 32 oz containers means one lid SKU instead of two. Fewer SKUs means simpler ordering and lower storage complexity.
The National Restaurant Association's operator packaging guidance calls out shared lid systems as a key SKU-reduction lever. If one lid fits across your 16 oz and 32 oz containers, you carry one lid SKU instead of two. Multiply that logic across your full container lineup and the simplification is real, measurable, and immediately visible in your storage area.
Why Do Bulk Thresholds Matter?
Direct Answer: Buying 500 units of 2 SKUs reaches volume pricing. Buying 100 units of 10 SKUs rarely does. The threshold matters more than the container price.
Five hundred units of two SKUs beats one hundred units of ten SKUs on almost every measure: per-unit price, reorder frequency, supplier negotiating leverage, and storage efficiency. When purchasing is spread across too many container types, none of them hit a volume threshold that earns better pricing. Consolidate, and each remaining SKU has a better chance of reaching stronger volume pricing.
| Purchasing Approach | Per-Unit Cost | Reorder Frequency | Storage Impact |
|---|---|---|---|
| 10 SKUs × 100 units each | High (no volume pricing) | Frequent | Spread thin across many products |
| 3 SKUs × 500 units each | Lower (volume pricing unlocked) | Less frequent | Deeper stock on fewer products |
Where Are Operators Quietly Losing Money on Packaging?
Direct Answer: Over-sizing, low-volume purchasing across too many SKUs, and cheap containers that generate complaints worth more than the per-unit savings.
None of these feel expensive in the moment. That is exactly the problem.
Over-sizing happens when operators pick a container because it fits rather than because it fits right. A 32 oz container used for a portion that needs 20 oz costs more per unit and signals to the customer that the serving looks smaller than it should. Right-sizing the container to the portion is both a cost lever and a presentation decision.
Low-volume purchasing is the most common margin leak. Buying 100 units of 10 different container types usually leaves less room for volume pricing than buying 500 units of 3 container types, both per unit and in the time spent managing reorders. Small operators often cite storage as the reason they cannot buy in higher volumes. The solution is to reduce the SKU count first, then go deeper on the containers that remain. Food trucks feel this version of the problem most sharply. With limited storage, many truck operators buy small quantities across multiple suppliers. The result: no volume pricing on any product, frequent reordering, and a storage area that is always either overstocked on the wrong item or short on the right one.
The quality downgrade trap is where cost-cutting creates a bigger problem than it solves. A cheaper container that fails on a delivery, causes a spill complaint, or triggers a refund request can wipe out months of per-unit savings in a handful of incidents. For a deeper look at the delivery failures that drive refunds, see Delivery-Proof Packaging: How to Prevent Spills, Condensation, and Crushed Food.
A simpler SKU list, bought in better volume from a supplier you trust, solves over-sizing, low-volume purchasing, and the downgrade trap in one move. You get better pricing, less waste from wrong-sized containers, and a container that actually survives the order.
Should Packaging Be Tracked as a Separate Cost Line?
Direct Answer: Yes. Track it as its own line. Operators who bundle packaging into supplies rarely know their per-order cost. Ask your accountant how to classify it in your own setup.
Most restaurant operators track food cost carefully. Packaging often disappears into a general supplies bucket and stays there. The problem is simple: you cannot negotiate, standardize, or reduce a cost you cannot see.
A practical monthly tracking routine does not need to be complicated:
- Total packaging spend for the month, broken out by product line
- Total order volume for the same period
- Cost per order (the two numbers divided)
When you track it this way, changes become visible. Switching from 12 container SKUs to 4 can show whether your cost per order is improving within a billing cycle or two. Without the tracking, those savings are invisible even while they are happening.
Here is what the math looks like in practice (worked example). A food truck running 80 orders per day, six days a week, processes around 1,900 orders per month. At $0.90 per order in packaging spend, that is $1,710 per month. At $0.65, it is around $1,235. The $475 monthly difference does not come from cheaper containers. It comes from a tighter SKU list, shared lids, and better volume pricing on each remaining product.
Does Switching to Cheaper Containers Actually Save Money?
Direct Answer: Not reliably. A container that fails on delivery costs more in refunds than it saved per unit. The real target is procurement structure, not a cheaper box.
The math on cheap containers often looks right until it does not. For example, if a $0.05 per-unit saving creates one complaint per 20 orders and each issue leads to a $15 refund or remake, the math turns ugly fast.
The National Restaurant Association's operator guidance recommends testing packaging with real takeout or delivery runs from your own menu before locking in a supplier. That test does not need to be a formal process. Run five to ten orders with the new container and see what comes back. If the lid loosens in the bag, if the base dents under weight, or if condensation compromises the food quality, that is your answer before you have committed to a full case quantity.
Test for temperature, texture, visual appeal, package integrity, and brand impact before switching containers.
The right question is not: "What is the cheapest container?" It is: "What is the most cost-efficient packaging setup for my menu and my order volume?" Those are different questions, and they lead to different decisions. For foodservice-grade containers across PP, PET, and specialty formats, browse the range at Plastic Container City and filter by container type and material rating.

The Numbers Have to Come First
Knowing how to reduce restaurant packaging costs starts with knowing what you actually spend, per order, per month, per container type. The operators who get packaging costs down without customer pushback are not buying the cheapest option on the shelf. They are buying smarter: fewer SKUs, higher volume per SKU, shared lid systems, and a standardized size range that covers the menu without the storage chaos.
The right starting point is that per-order calculation. Run those numbers this week. If the data is not there yet, that is the first problem to fix. For a complete view of how container choice shapes the rest of your off-premises operation, from material selection to size frameworks to compliance, start with How to Choose Takeout Containers for Your Restaurant. For more resources built for working food professionals, visit the Plastic Container City blog.
Frequently Asked Questions
How much do restaurants spend on packaging?
Direct Answer: Packaging spend varies widely by volume, menu complexity, container type, and supplier relationship. A more actionable metric is cost per order: total monthly packaging spend divided by total monthly orders.
There is no single published benchmark that applies cleanly across all restaurant types and sizes. The per-order calculation is more useful because it gives you a number you can actually move. Once you have it, every procurement decision has a clear cost frame to test against.
Is packaging cost part of COGS?
Direct Answer: How packaging is classified depends on your own setup. Ask your accountant. Operationally, tracking it separately from general supplies gives you the visibility needed to reduce it.
Some operators track packaging within cost of goods sold to get a cleaner per-order profitability picture. Others keep it in operational supplies. The accounting category matters less than the visibility. If you cannot see the number separately, you cannot manage it.
What is the most cost-effective packaging for restaurants?
Direct Answer: The most cost-effective packaging is the right container, bought in volume, across the fewest SKUs possible. PP for hot food and PET for cold food, in three core sizes, covers most menus at the lowest total cost per order.
Cost-effectiveness is not just the per-unit price. It includes reorder frequency, storage space, lid compatibility, and the cost of failed containers that generate complaints. A properly rated container bought in volume often costs less per order than a cheaper one bought in small batches across multiple suppliers.
What percentage of food costs packaging?
Direct Answer: There is no clean benchmark in the research set. Track packaging per order so the number reflects your menu and order volume.
Published benchmarks vary too widely across restaurant types to be useful as a standalone target. Your per-order figure, calculated from your own invoices and order count, is the only number that actually reflects your operation.
How to improve packaging efficiency?
Direct Answer: Reduce your SKU count, use shared lids where possible, track reorder patterns, and buy deeper on the container formats you use most.
Packaging efficiency is about removing unnecessary complexity from your purchasing and storage. Fewer container types, better volume on each, and a lid that works across sizes will do more for your per-order cost than switching to a cheaper product ever will.